How to use Azure Anomaly Detector to find anomalies in electricity consumption?

Electricity prices are seeking all-time high figures in Finland and most of Europe. I wanted to investigate my electricity consumption a bit more and use Azure AI services to find anomalies in the consumption data.
I'll show in this blog post how to create a small console application (C#) that processes hourly electricity consumption time series data from one one-year period and utilizes Azure Anomaly Detector to find anomalies.
What is Azure Anomaly Detector?
Azure Anomaly Detector is a part of the Azure AI platform and provides a robust service for monitoring and detecting anomalies from your time series data without having to know machine learning. Time series data can be sent at once in a batch or anomalies can be detected also from streaming data.
When time series data is sent at once, the API will generate a model using the entire series, and analyze each data point with it. When real-time streaming is used model will be generated with the data points you send, and the API will determine if the latest point in the time series is an anomaly.
Azure Anomaly Detector utilizes multiple algorithms and automatically identifies and applies the best-fitting models to your time series data, regardless of industry, scenario, or data volume. You can find more information about the used algorithms here.
With the Anomaly Detector, you can either detect anomalies in one variable using a Univariate Anomaly Detector or detect anomalies in multiple variables with a Multivariate Anomaly Detector.
In this sample, I'll use the Univariate Anomaly Detector. Maybe later I'll try a Multivariate Anomaly Detector to use multiple variables like electricity consumption and temperature.
Sources:
- What is Anomaly Detector? - Azure Cognitive Services | Microsoft Docs
- How to use the Anomaly Detector API on your time series data - Azure Cognitive Services | Microsoft Docs
- Introducing Azure Anomaly Detector API - Microsoft Tech Community
- Overview of SR-CNN algorithm in Azure Anomaly Detector - Microsoft Tech Community
- What is the Univariate Anomaly Detector? - Azure Cognitive Services | Microsoft Docs
- What is Multivariate Anomaly Detection? - Azure Cognitive Services | Microsoft Docsthe
Overview of the sample application
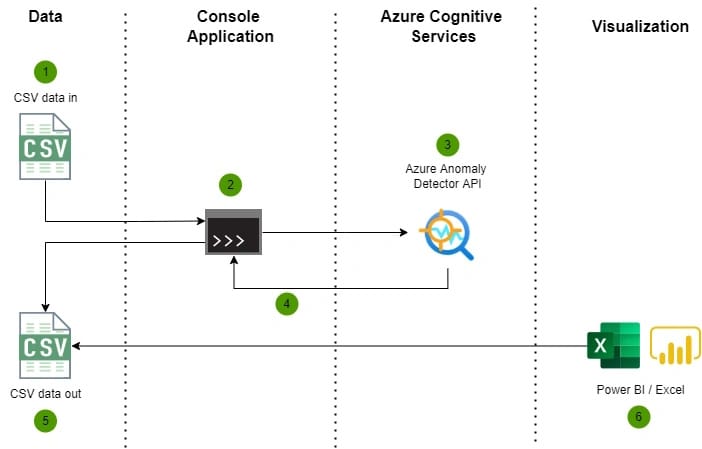
The console application takes CSV data (electricity consumption) in and processes data via Azure Anomaly Detector API. Application utilizes a Univariate Anomaly Detector to detect anomalies from one variable which is in this case electricity consumption. Lastly, results of Anomaly detection will be written to another CSV file which can later used for visualization purposes.

Console application
Required Nuget packages
The following NuGet package is required to enable the Anomaly Detector service from Azure:
Azure.AI.AnomalyDetectorThis application uses CsvHelper package to write easily CSV files:
CsvHelperConfiguration and Azure credentials
The following Anomaly Detector service credential and CSV paths are configured in the appsettings.json file of the application. You need to first create an Azure Cognitive Service resource and then you can create an Anomaly Detector.
{
  "AzureCognitiveServices": {
    "EndPoint": "https://[YOUR-COGNITIVE-SERVICE].cognitiveservices.azure.com/",
    "Key": "" // This is a Anomaly Detector key which can be found from Keys and Endpoint under Anomaly Detector resource
  },
  "Csv": {
    "InPath": "C:\\Data\\AnomalyDetector\\In\\2021-01-01_2021-12-31_hour.csv",
    "OutPath": "C:\\Data\\AnomalyDetector\\Out\\results.csv"
  }
}
Main application
The main application orchestrates the reading of CSV input data, anomaly detection via Anomaly Detector, and writing of results to CSV.
using Azure.AI.AnomalyDetector.Models;
using ElectricityConsumptionAnalyzer.Console;
using Microsoft.Extensions.Configuration;

var configuration = new ConfigurationBuilder()
        .SetBasePath(Directory.GetCurrentDirectory())
        .AddJsonFile("appsettings.json")
        .Build();

var csvInputPath = configuration["Csv:InPath"];
var csvOutputPath = configuration["Csv:OutPath"];

Console.WriteLine("Hello, press any key to start anomaly detection.");

var anomalyDetectorService = new AnomalyDetectorService(configuration);

// creates time serie data from CSV file
var timeSerie = TimeSerieHelper.ReadCsv(csvInputPath);

// analyzes time serie data
var timeSerieAnalysis = await anomalyDetectorService.AnalyzeTimeSerie(timeSerie, TimeGranularity.Hourly, ImputeMode.Auto, 99);

// write results to CSV file
TimeSerieHelper.WriteCsv(csvOutputPath, timeSerieAnalysis);

Console.WriteLine("Anomaly detection completed.");
You should be aware of the following parameters which are provided to AnalyzeTimeSerie method:
TimeGranularity = Optional argument, can be one of yearly, monthly, weekly, daily, hourly, minutely, secondly, microsecond, or none. If granularity is not present, it will be none by default. If the granularity is none, the timestamp property in the time series point can be absent.
InputeMode = Used to specify how to deal with missing values in the input series, it's used when granularity is not "none".
Sensitivity = Optional argument, advanced model parameter, between 0-99, the lower the value is, the larger the margin value will be which means fewer anomalies will be accepted.
AnomalyDetectorService
AnomalyDetectorService is responsible for handling communication with Azure Anomaly Detector and transforming data to a format that is easy to consume later and write to a CSV file.
using Azure;
using Azure.AI.AnomalyDetector;
using Azure.AI.AnomalyDetector.Models;
using Microsoft.Extensions.Configuration;

namespace ElectricityConsumptionAnalyzer.Console
{
    public class AnomalyDetectorService: IAnomalyDetectorService
    {
        private AnomalyDetectorClient _anomalyDetectorClient;
        public AnomalyDetectorService(IConfiguration configuration)
        {
            var cognitiveServiceEndpointUriString = configuration["AzureCognitiveServices:EndPoint"] ?? throw new ArgumentNullException("AzureCognitiveServices:EndPoint is missing");
            var apiKey = configuration["AzureCognitiveServices:Key"] ?? throw new ArgumentNullException("AzureCognitiveServices:Key is missing");

            var endpointUri = new Uri(cognitiveServiceEndpointUriString);
            var credential = new AzureKeyCredential(apiKey);

            //create client
            _anomalyDetectorClient = new AnomalyDetectorClient(endpointUri, credential);
        }

        public async Task<List<TimeSerieAnalysisResponse>> AnalyzeTimeSerie(
            IList<TimeSeriesPoint> timeSerie,
            TimeGranularity timeGranularity,
            ImputeMode imputeMode,
            int sensitivity)
        {
            var request = new DetectRequest(timeSerie)
            {
                Granularity = timeGranularity,
                ImputeMode = imputeMode,
                Sensitivity = sensitivity
            };

            var analysisResult =  await _anomalyDetectorClient.DetectEntireSeriesAsync(request).ConfigureAwait(false);

            return await MapData(request.Series, analysisResult);
        }

        /// <summary>
        /// Maps original time serie data and anomaly detection results to unified object
        /// </summary>
        /// <param name="timeSeriesRequest"></param>
        /// <param name="timeSeriesAnalysisResult"></param>
        /// <returns></returns>
        private async Task<List<TimeSerieAnalysisResponse>> MapData(
            IList<TimeSeriesPoint> timeSeriesRequest,
            EntireDetectResponse timeSeriesAnalysisResult)
        {
            var analysis = new List<TimeSerieAnalysisResponse>();

            for (int i = 0; i < timeSeriesRequest.Count; ++i)
            {
                var data = new TimeSerieAnalysisResponse()
                {
                    Timestamp = timeSeriesRequest[i].Timestamp.Value,
                    Consumption = timeSeriesRequest[i].Value,
                    IsAnomaly = timeSeriesAnalysisResult.IsAnomaly[i]
                };

                if (timeSeriesAnalysisResult.IsAnomaly[i])
                {
                    data.AnomalyValue = timeSeriesRequest[i].Value;
                    data.Severity = timeSeriesAnalysisResult.Severity[i];
                    data.LowerMargins = timeSeriesAnalysisResult.LowerMargins[i];
                    data.UpperMargins = timeSeriesAnalysisResult.UpperMargins[i];
                    data.ExpectedValues = timeSeriesAnalysisResult.ExpectedValues[i];
                    data.IsNegativeAnomaly = timeSeriesAnalysisResult.IsNegativeAnomaly[i];
                    data.IsPositiveAnomaly = timeSeriesAnalysisResult.IsPositiveAnomaly[i];
                    data.Period = timeSeriesAnalysisResult.Period;
                }
                analysis.Add(data);
            }

            return analysis;
        }
    }
}
TimeSerieHelper
TimeSerieHelper is just a small helper class to help read and write CSV files. CSV writing is handled with a great CSVHelper library.
using Azure.AI.AnomalyDetector.Models;
using CsvHelper;
using System.Globalization;
using System.Text;

namespace ElectricityConsumptionAnalyzer.Console
{
    public class TimeSerieHelper
    {
        public static IList<TimeSeriesPoint> ReadCsv(string csvFilePath)
        {
            return File.ReadAllLines(csvFilePath, Encoding.UTF8)
                .Where(e => e.Trim().Length != 0)
                .Select(e => e.Split(';'))
                .Where(e => e.Length == 2)
                .Select(e => CreateTimeSerie(e)).ToList();
        }

        static TimeSeriesPoint CreateTimeSerie(string[] e)
        {
            var timestampString = e[0];
            var consumption = e[1];
            return new TimeSeriesPoint(float.Parse(e[1])) { Timestamp = DateTime.Parse(timestampString) };
        }

        public static void WriteCsv(string csvFilePath, List<TimeSerieAnalysisResponse> timeSeriesAnalysisResult)
        {
            using (var writer = new StreamWriter(csvFilePath))
            using (var csv = new CsvWriter(writer, CultureInfo.InvariantCulture))
            {
                csv.WriteRecords(timeSeriesAnalysisResult);
            }
        }
    }
}
Data In and Out
Data In: Hourly electricity consumption from one year period
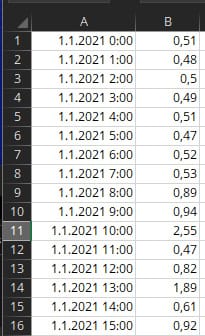
My electricity company provides manual data export functionality from their own portal. Data can be exported in a CSV format. I'll use hourly electricity consumption for one year in this sample. Data that is feed to the console application looks like this (timestamp + electricity consumption):

Note! The minimum time series points are 12 points, and the maximum is 8640 points. I needed to remove a couple of weeks of data from December to get this fit to 8640 points.
Data Out: Enriched data with anomaly results
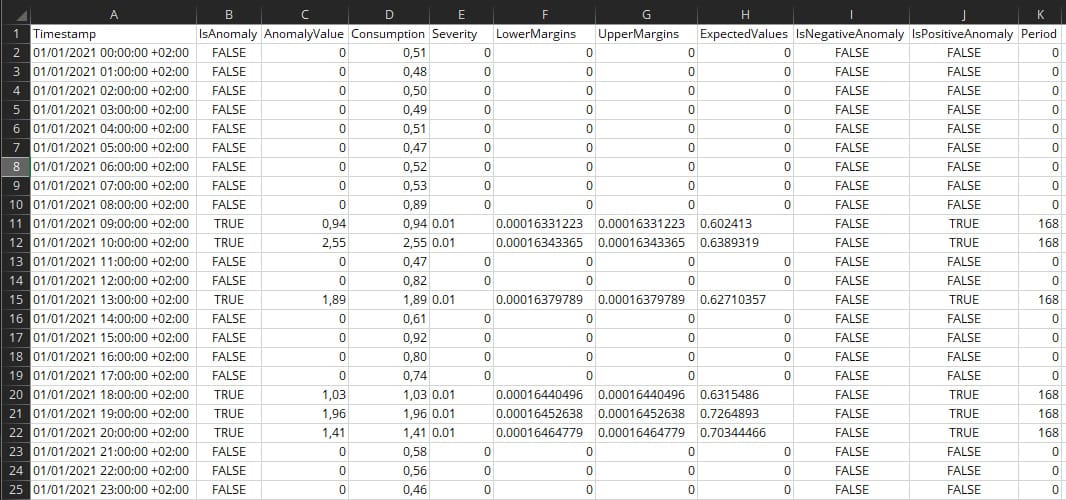
Console application enriches anomaly detection results provided by Azure Anomaly Detection to the CSV file. After enrichment file looks like this:

What does these fields mean?
The second field in the dataset (IsAnomaly) indicates whether the point is a positive or negative anomaly. Datasets also have different fields for indicating negative or positive anomalies. Positive anomaly means that the analyzed value is higher than the expected value and negative other way around.
According to documentation: By default, the upper margin and lower margin boundaries for anomaly detection are calculated using ExpectedValue, UpperMargin, and LowerMargin. If you require different boundaries, we recommend applying a MarginScale to UpperMargin or LowerMargin. The boundaries would be calculated as follows:
UpperBoundary
ExpectedValue + (100 - MarginScale) * UpperMarginLowerBoundary
ExpectedValue - (100 - MarginScale) * LowerMargin
Did the Anomaly Detector find any anomalies in the data?
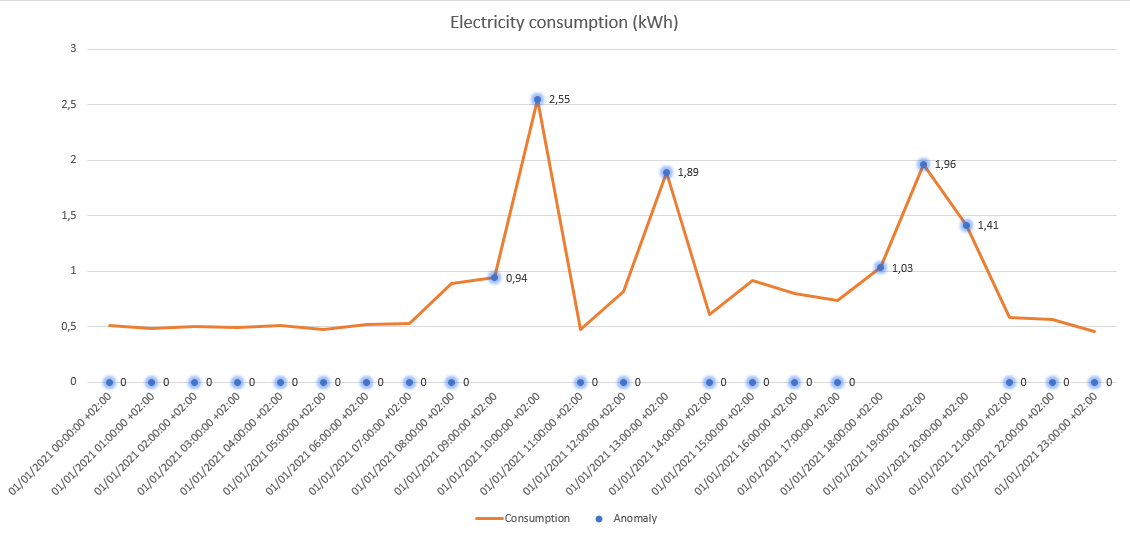
The time serie which was used in this sample contained 8640 data points. The below chart illustrates electricity consumption for one day (1.1.2021) an hour level. Consumption values greater than 0 with a blue dot are identified as an anomaly. Azure Anomaly Detector has identified consumption peaks nicely! This is a short snapshot of the data but overall this seems accurate. I will analyze consumption patterns more later and it would be also interesting to test Multivariate Anomaly Detection with multiple variables like electricity consumption and temperature.
Overall Azure Anomaly Detector is a very interesting service especially when you don't need to know machine learning and algorithms.

The full source code of this sample application can be found on GitHub.
Comments